View By Date Contact Me
ABSENCE
Posted: 4th April 2012

http://www.chrisjordan.com/gallery/rtn2/#year-of-the-tiger
I was following up researching Chris Jordan after seeing his TED talk - Chris Jordan pictures some shocking stats and I came across more pieces of his work.
There are some really interesting visual interpretations of statistics (plastic bags, objects in the sea etc.) but I found this one so compelling. His website reads:
Year of the Tiger, 2010 62x62"
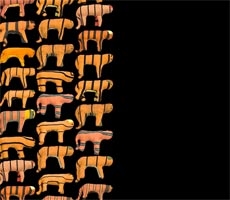
Depicts 3200 toy tigers, equal to the estimated number of tigers remaining on Earth. The space in the middle would hold 40,000 of these tigers, equal to the global tiger population in 1970.
The vast expanse that depicts what was is so poignant. The small, thin border depicting the remaining 8% of the population could be mistaken for the frame at first glance.
I feel that within his TED talk there were real insight into our current social norms - that we are not pushed to think of the bigger numbers as real people, issues, resources. This approach could be a real presentation tool for polictians and policy makers to see the 'realness' of statistics.
I almost want this concept to be an interactive website - that people could create their own representations of numbers through duplication...where's an app when you need one!?

Further Reading
Lisa Park - Euonia

Reading about Lisa Park's work - Euonia (Greek for Beautiful Thinking) I was really interested in the idea of technology interfaces.