View By Date Contact Me
INFOGRAPHICS
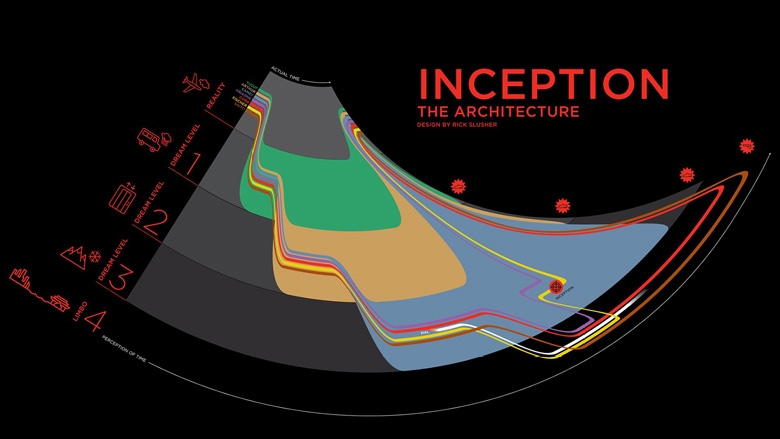
Posted: 3rd May 2012Here are a selection of images and infographics that caught my eye (maybe I won't admit some *might* have been from the time-sucking black-hole of Imgur!)...
I'm interested in how numbers, statistics and information can be displayed in visual forms. Similar to Chris Jordan's quest for humanising shocking statistics.
10 May 2012
25 Sept 2012
Peter Hamburger's Venn Diagram
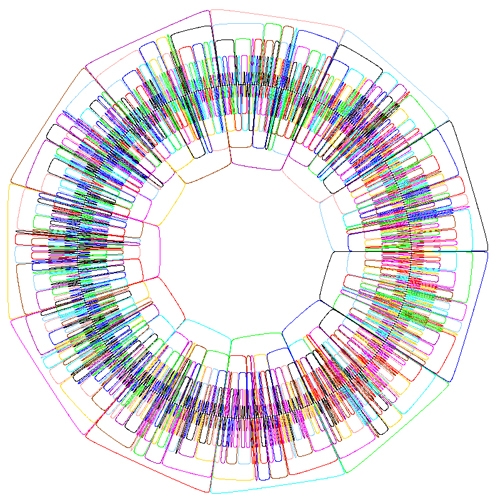
http://www.newscientist.com/gallery/venn/8
Related Themes
Further Reading
Writing and Reading

Small TEDx talk about Kleon's analysis of the publishing chain and how blogs give a direct readership rather than publishers.